

More Data, Less Overhead: croit’s New Metrics and Logging System
Starting with v2503.0, croit now ships with VictoriaMetrics and VictoriaLogs for displaying metrics and logs collected across your cluster.
In the past we relied on Graphite for metrics and a journald upload remote server for logs. These didn’t scale up well on larger clusters when it comes to processing queries as well as storage taken up in the croit app.
VictoriaMetrics and VictoriaLogs act almost as drop-in replacements. VictoraMetrics offers Graphite functionality, and internally in croit we still rely on the Graphite API it provides. VictoriaLogs gives us a new faster way of querying and filtering logs, while it still collects journald logs from the entire cluster like before.
The new log view
Apart from better performance, we’ve also added some new features to our log view to make finding important logs easier.
Above the logs you will now see an overview of how many lines logged across the configured time range:
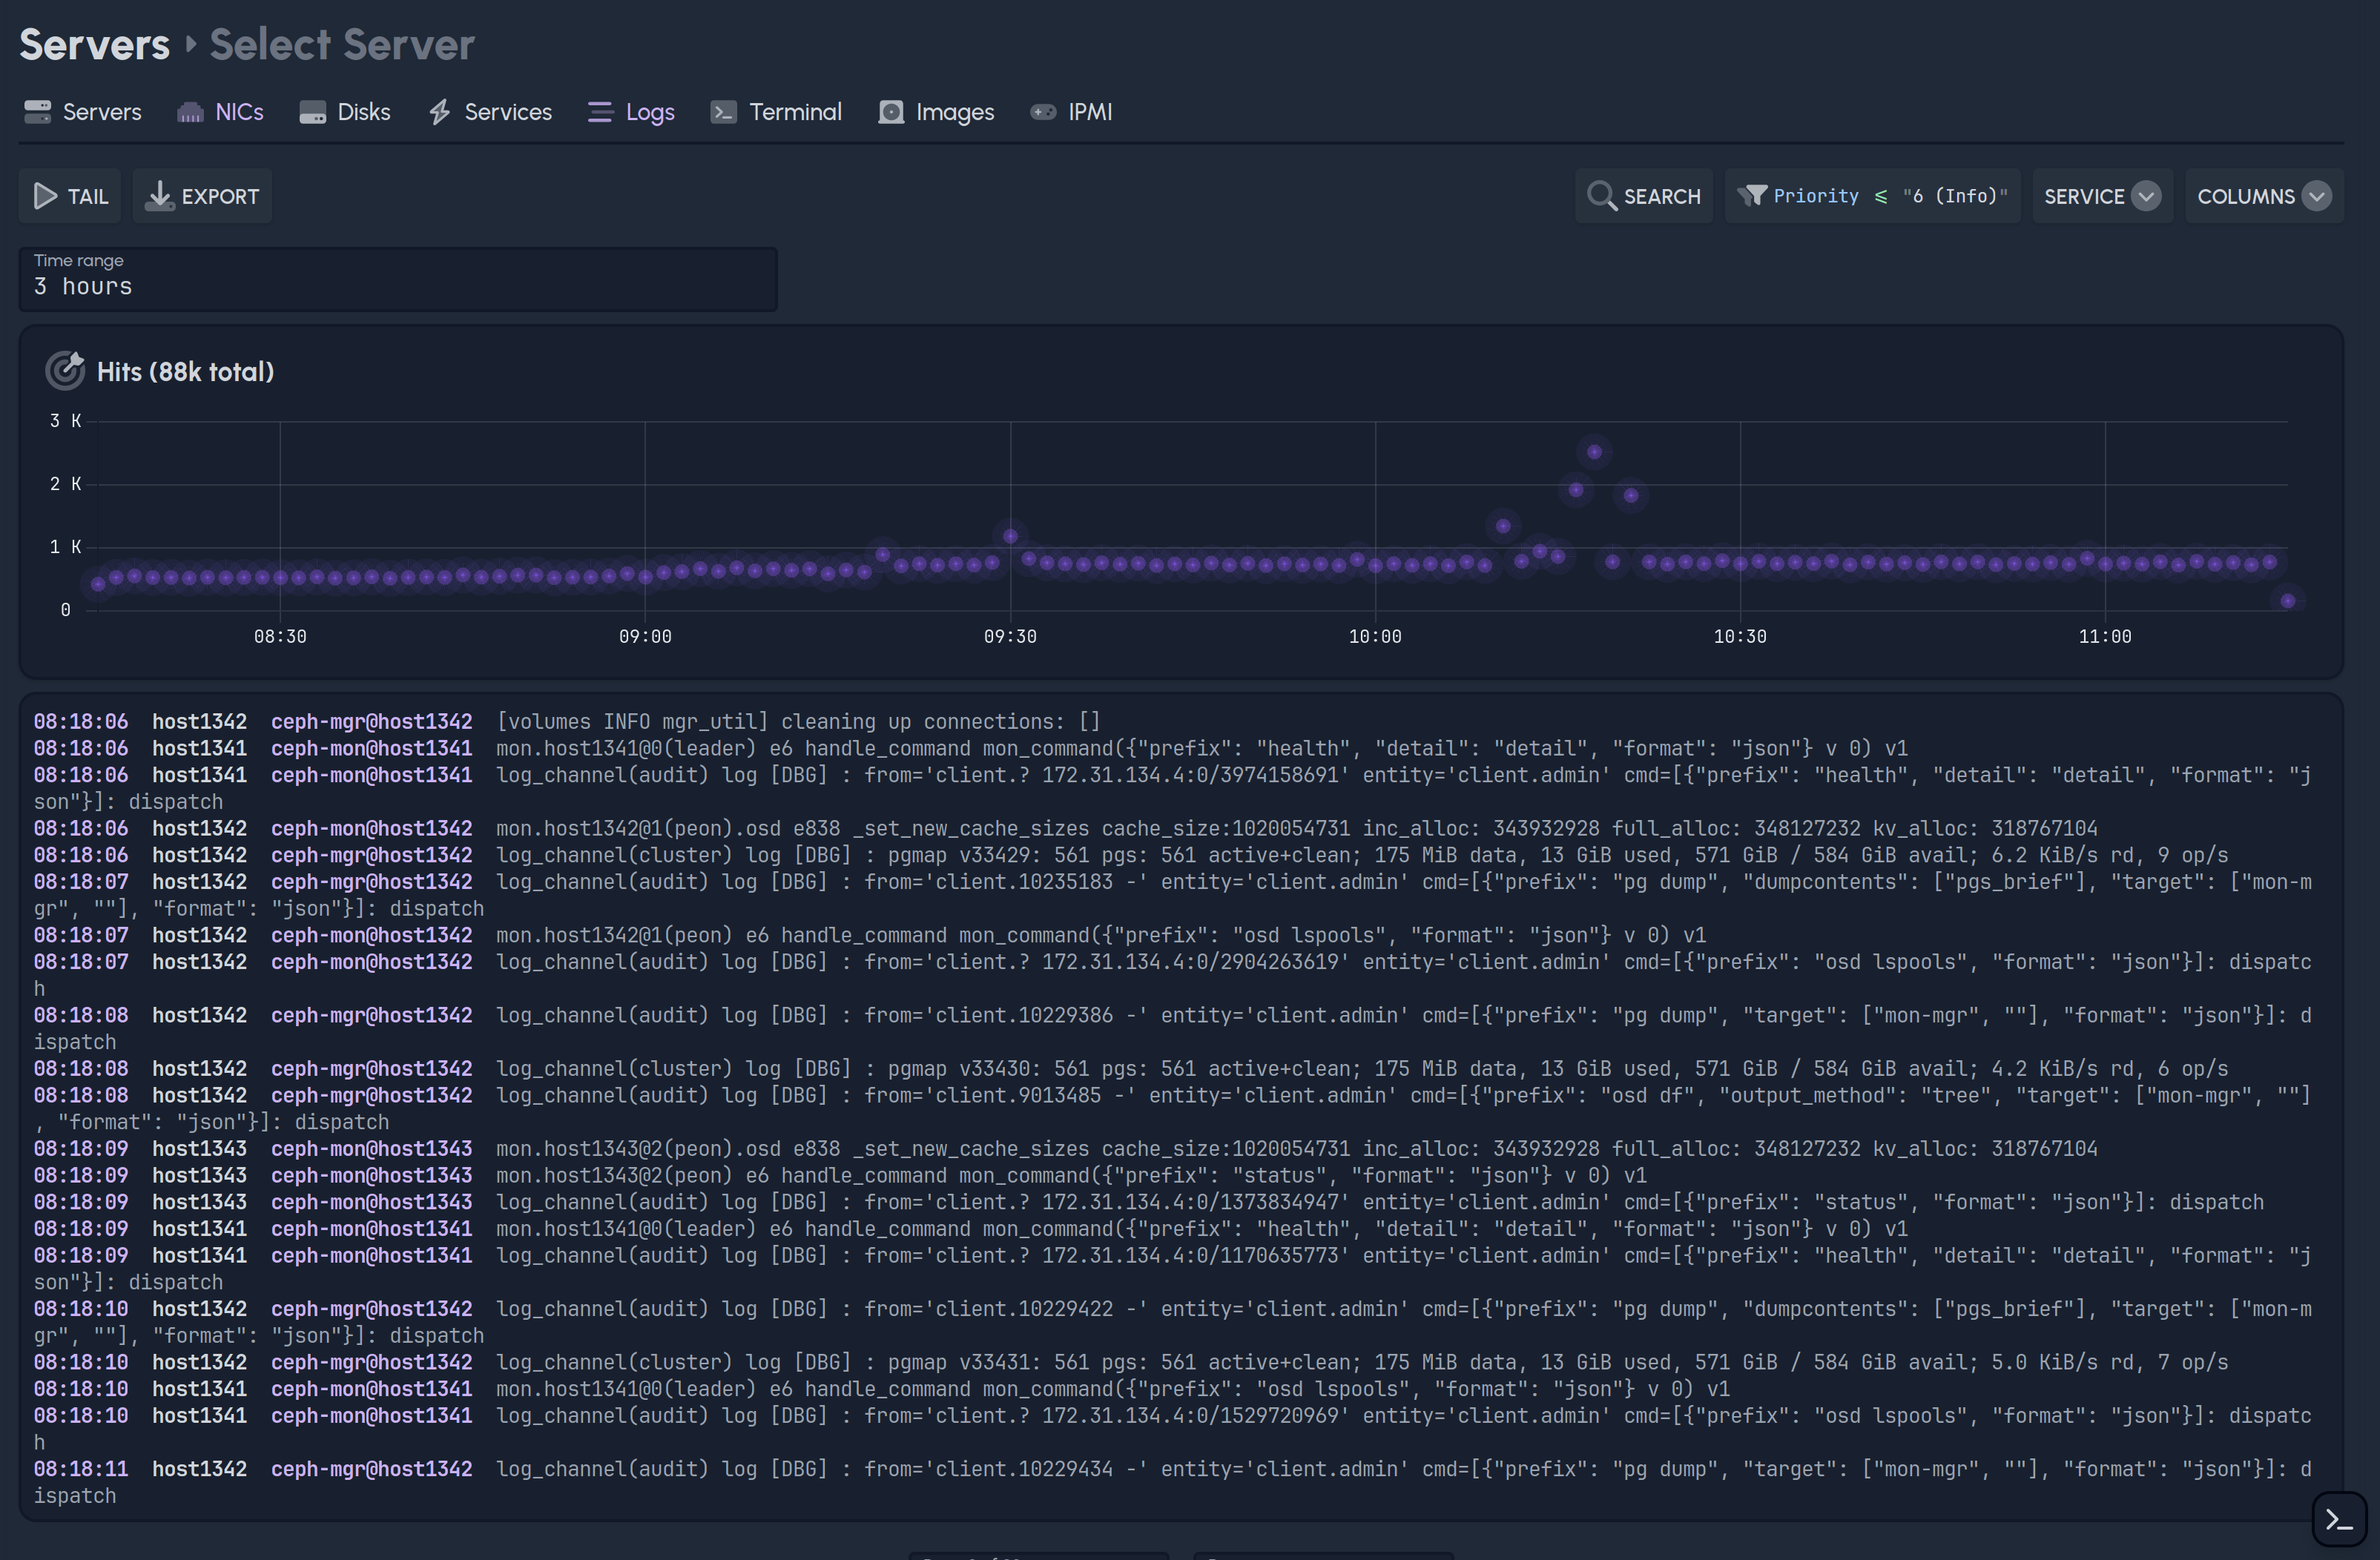
Each “hit” is a single log entry, and you can hover over the dots in the graph to see the how many log events happened at that point in time. You can also select an area in the graph to only show logs during that time:
Using the new hits graph you can easily identify hotspots of logs at a glance, and quickly jump to those hotspots for further investigation.
To make debugging issues easier and more organized, we’ve also added a way to link to specific log lines directly. While hovering over a log line, a new link button will appear on the left:
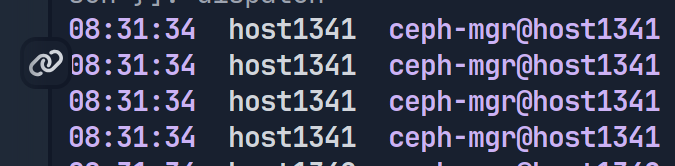
Clicking the button will open the log viewer in a new tab, with a link directly to this log line. The log line will be highlighted, and the link can be shared with others to collaborate during debugging sessions.
New settings for logging and metrics
On the metrics side, nothing much has changed from a user perspective. However, there are a few new settings that can be configured:
croit metrics retention periodlet’s you configure how long metrics data is stored for. We default to “30d” for metrics, i.e. 30 days.croit metrics min disk spacespecifies how much disk space needs to be kept free by VictoriaMetrics. This let’s us guarantee that enough disk space is available for e.g. croit updates.croit metrics memory percentis a limit on how much memory VictoriaMetrics gets to consume.
If you want to run your own VictoriaMetrics instance you can configure croit victoria metrics url to point to it and any metrics queries and collection will be rerouted to your instance.
For VictoriaLogs, we’ve added similar new settings:
croit logs retention periodlet’s you configure how long metrics data is stored for. We default to “90d” for logs, i.e. 90 days.croit logs max disk spacespecifies how much disk space VictoriaLogs is allowed to use in total.croit logs min disk spacespecifies how much disk space needs to be kept free by VictoriaLogs. This let’s us guarantee that enough disk space is available for e.g. croit updates.croit logs memory percentis a limit on how much memory VictoriaLogs gets to consume.
Likewise, if you want to run your own VictoriaLogs instance, you can modify the settings croit victoria logs url (this URL will be used for querying logs via our UI) and croit victoria logs upload url (this URL is used as the target for uploading logs to, and needs to be reachable by all nodes in your cluster).
We also added 2 new templates victoria-metrics and victoria-logs used to create the configuration for VictoriaMetrics and VictoriaLogs respectively. You can modify these templates if you want to further configure these services, but we would love to hear about any changes you need so we can add settings for them directly into croit.
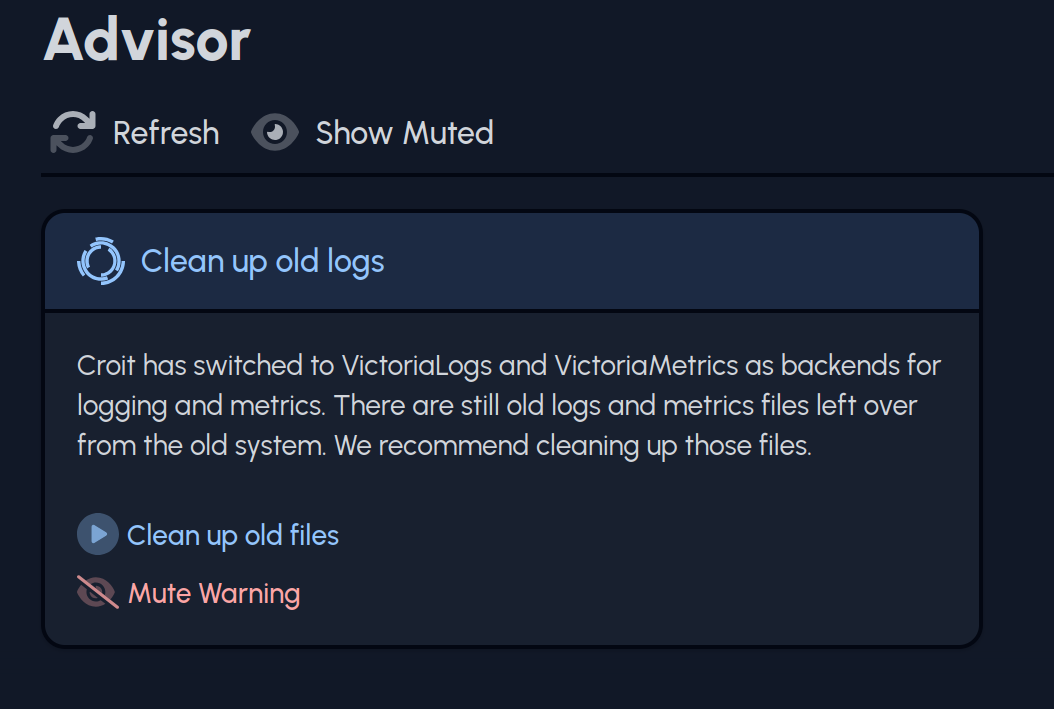
Cleaning up old data
The old logging and metrics data won’t be imported into VictoriaMetrics and VictoriaLogs, and should be cleaned up. You can check the task advisor for a clean up task:
You can also wait a week or two before cleaning up the old data, in case you want to keep the old logs until they would be replaced with new logs. If you need to access the old logs, you can temporarily install journalctl again:
$ apt-get update && apt-get install --no-install-recommends systemd
$ unset -f journalctl
$ alias journalctl='journalctl -m -D /logs/'
$ journalctl -u ...
As we’re using VictoriaLogs now, journalctl within the croit container won’t be available anymore (though it’s still available on the individual servers). If there are any features missing or other shortcomings of the log viewer, please let us know.
In case you need a CLI utility inside the croit container to access the logs, we also provide VictoriaLogs' official CLI vlogscli. The CLI is interactive, simple run vlogscli and you’ll see a prompt for running queries. We recommend first running \c for more readable ouput. Here are some example queries to get you started:
- To get the kernel messages for a specific server from the last 24 hours:
_TRANSPORT:"kernel" AND _HOSTNAME:="hostnameXYZ" AND _time:24h | format "[<_time>] <_msg>" | sort by (_time) | fields _msg; - Searching OSD logs from the last 3 days that contain some string:
_msg:~"some string" AND _SYSTEMD_UNIT:"ceph-osd" AND _time:3d | format "[<_time>]<_HOSTNAME> <_SYSTEMD_UNIT>: <_msg>" | sort by (_time) | fields _msg; - Get the logs for a specific OSD excluding logs about scrubbing:
NOT _msg:~"scrub" AND _SYSTEMD_UNIT:"ceph-osd@123" | format "[<_time>]<_HOSTNAME> <_SYSTEMD_UNIT>: <_msg>" | sort by (_time) | fields _msg;
You can read more about vlogscli and its query language used here.
24/7 premium support
With croit every IT team is able to operate powerful, reliable and easy to use scale-out storage. Our storage management software supports all common interfaces, takes most of the work off your hands and makes daily operations much smoother. But if you still need us, we are there for you quickly, reliably and round-the-clock.